selected Prototypes
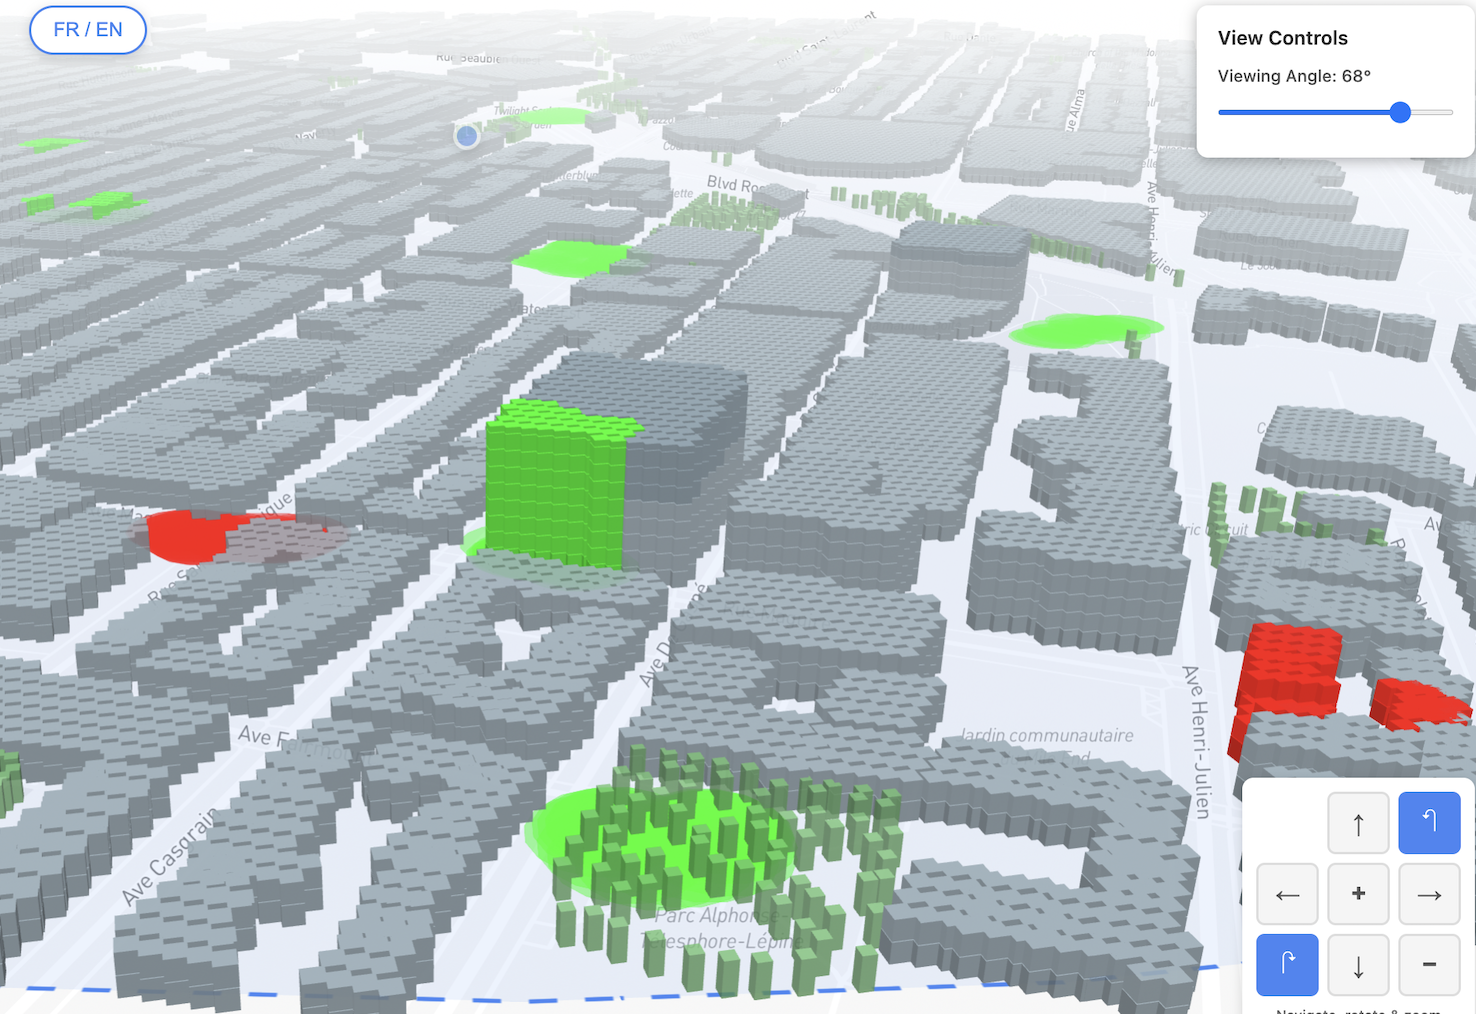
Tag ta ville
This is a crowdsourced web mapping platform where citizens paint 3D buildings and ground surfaces in their neighborhood to flag areas they like or dislike. Marked zones are automatically clustered and labeled using thematic categories, generating structured geospatial data for urban research and municipal planning. Built with Mapbox GL JS, Turf.js, DBSCAN clustering, and a Node.js/PostgreSQL backend.
Website: www.tagtaville.ca
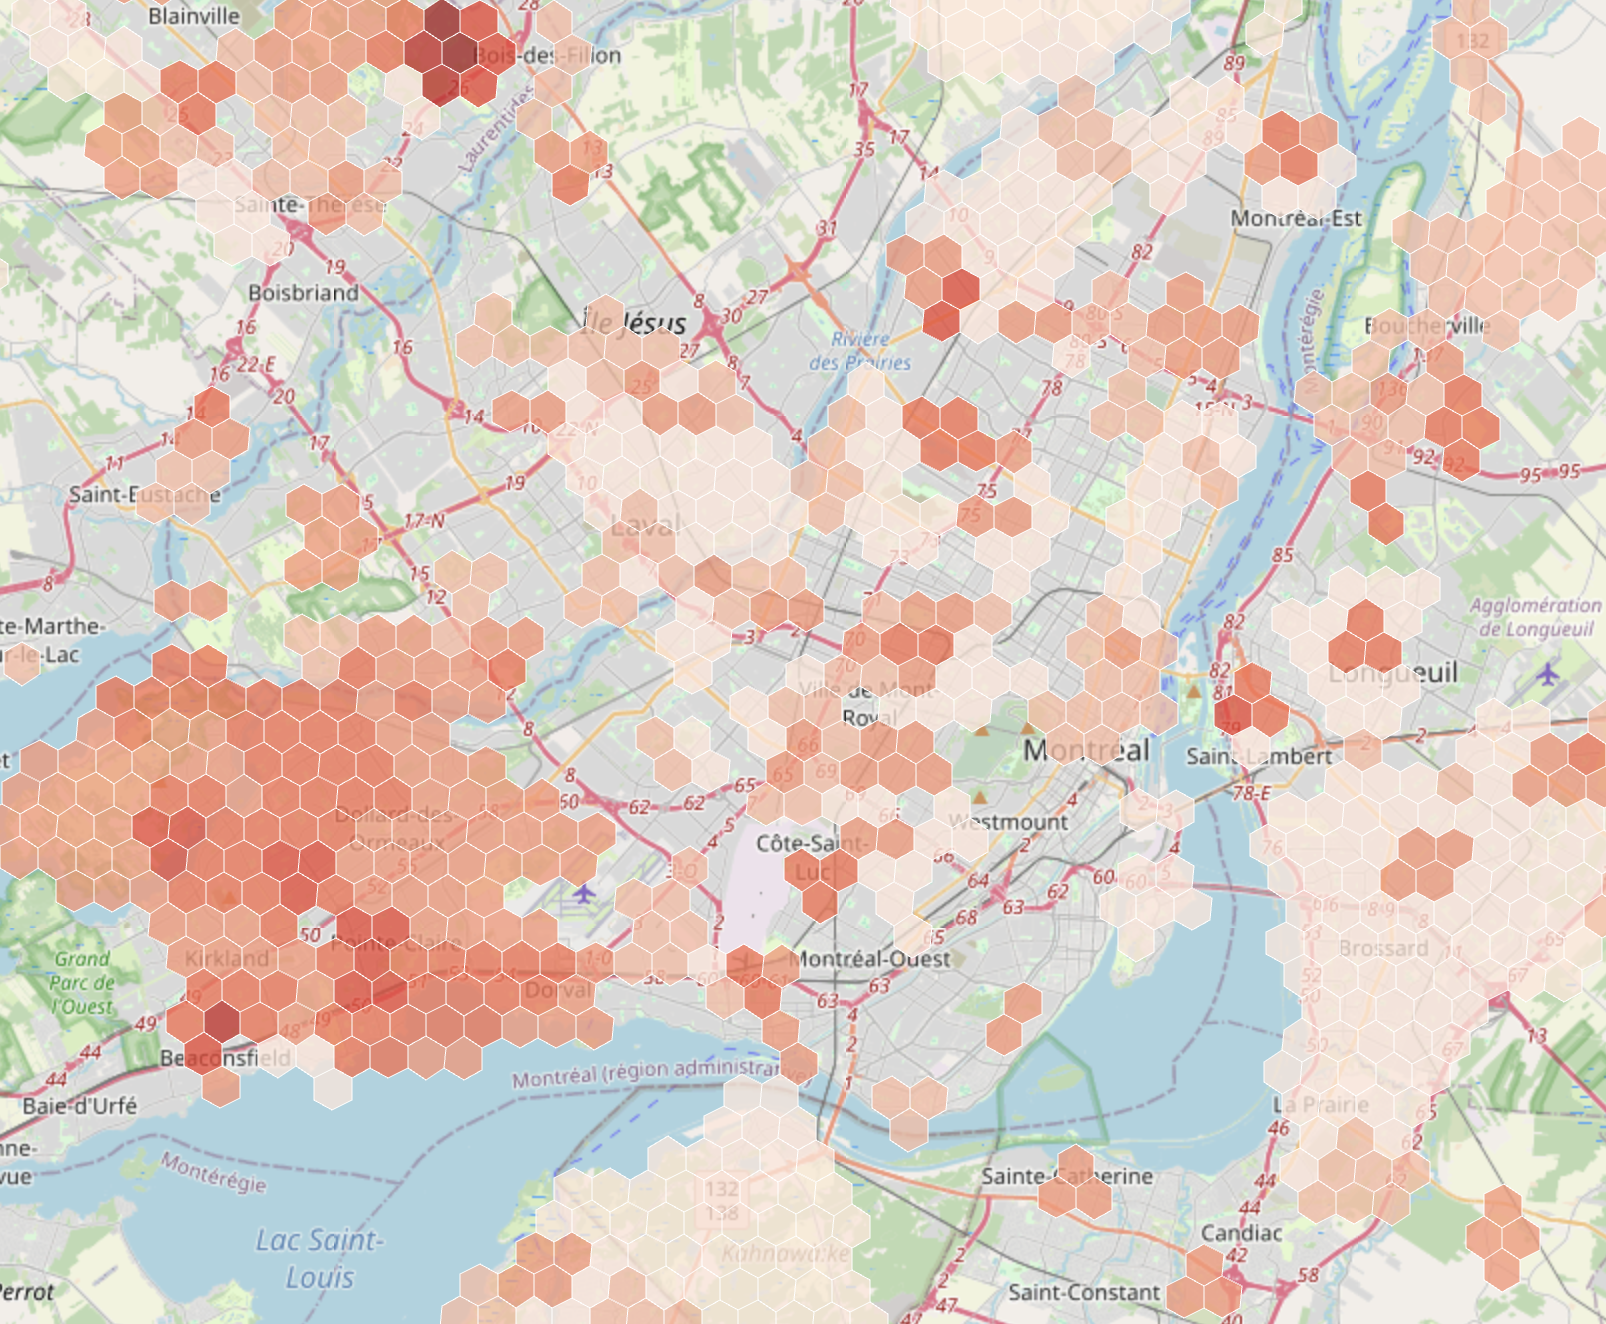
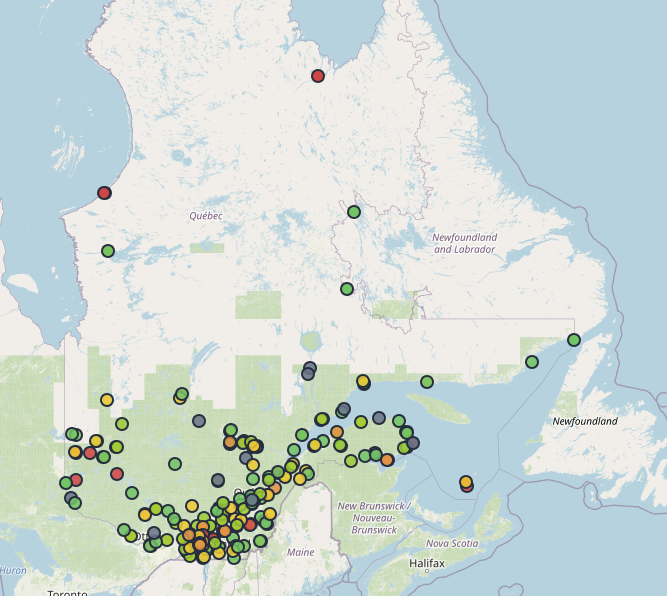
Où sont les pannes?
This website tracks power outages across Quebec by scraping Hydro-Québec's data every hour and displaying them on an interactive map. The province is divided into 1km hexagonal tiles, with each hex showing how many hours it's been affected by outages over the past month. It's built with R for data processing and spatial analysis (sf, dplyr), JavaScript and Leaflet.
Website: http://ousontlespannes.ca/
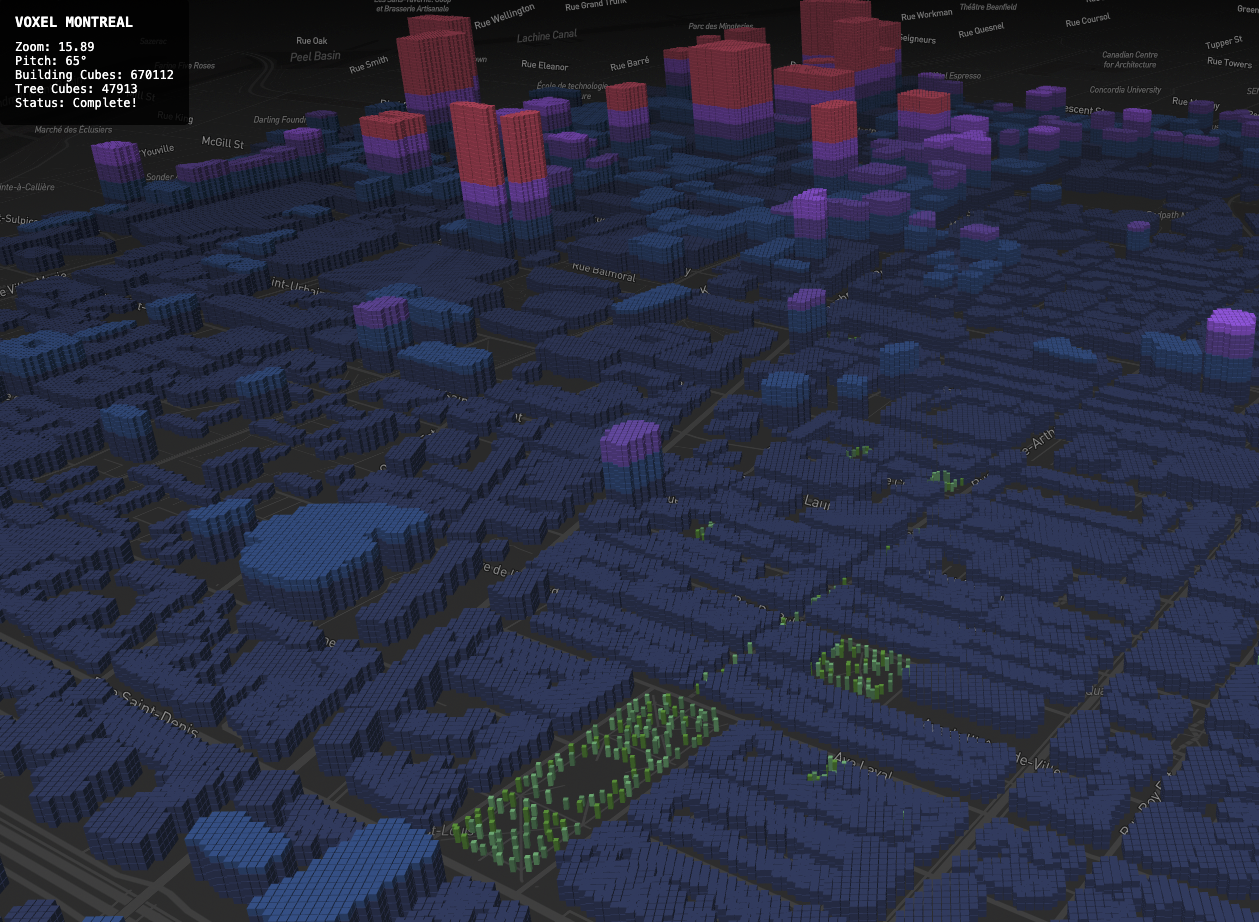
Voxelized Montréal
This website shows a 3D map of Montreal where buildings are transformed into small stacked cubes, creating a digital, block-like version of the city. It’s built with HTML, CSS, and JavaScript, using Mapbox for the interactive map and Turf.js to calculate where each cube should appear based on real building data. The goal is to create an artistic, voxel-style city that turns urban space into an immersive visual experience.
Work in progress: early beta release
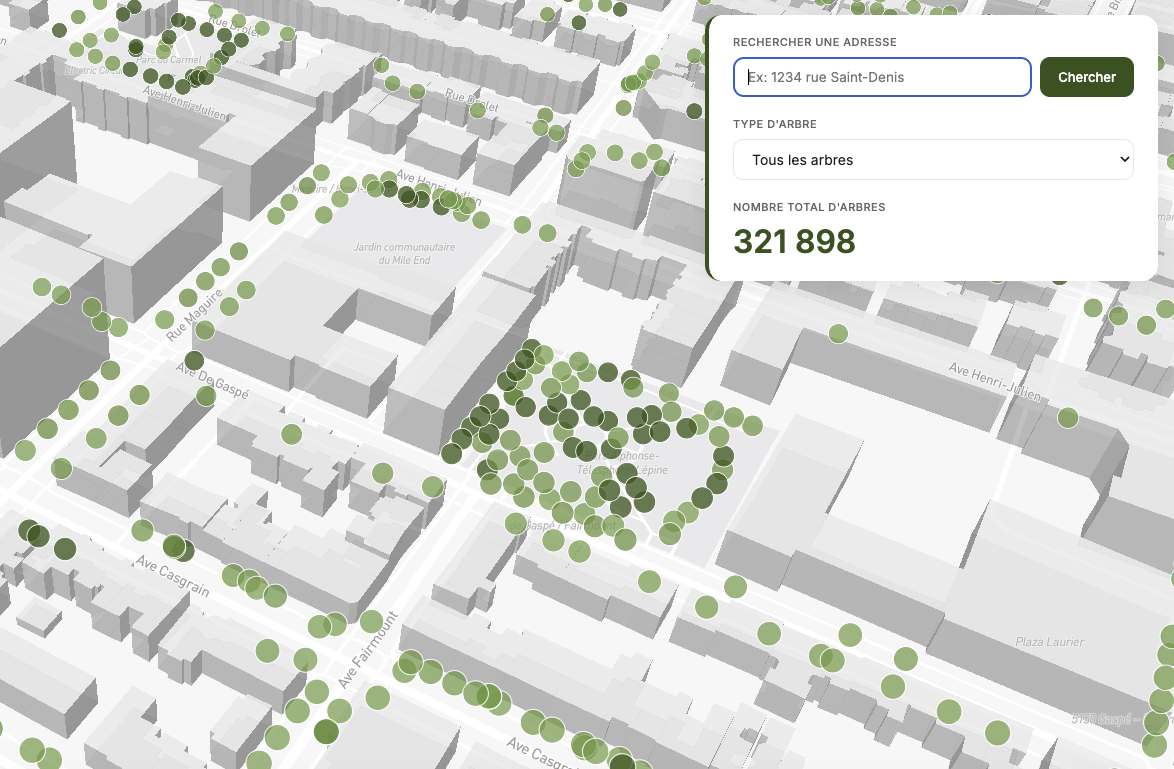
Tree Timeline Montréal
This website visualizes Montreal's tree planting chronology using open access tree data from the City of Montreal. It displays over 331,000 trees on an interactive map, showing when each was planted from 1960 to 2025. Users can explore the city's greening evolution over time with a timeline slider, filter by tree species, and search specific addresses. The map uses clustering for performance and shows cumulative tree planting as you move through the decades. It's built with Python for data processing, JavaScript for the interactive timeline, and Mapbox for the map visualization with 3D buildings.
Governmental buildings Energy Footprint
This interactive map tracks energy use and GHG emissions across 3,740 institutional buildings in Quebec. Buildings are color-coded by quartiles across various metrics including electricity consumption, natural gas usage, and CO₂ emissions per square meter. Built with Python and JavaScript.
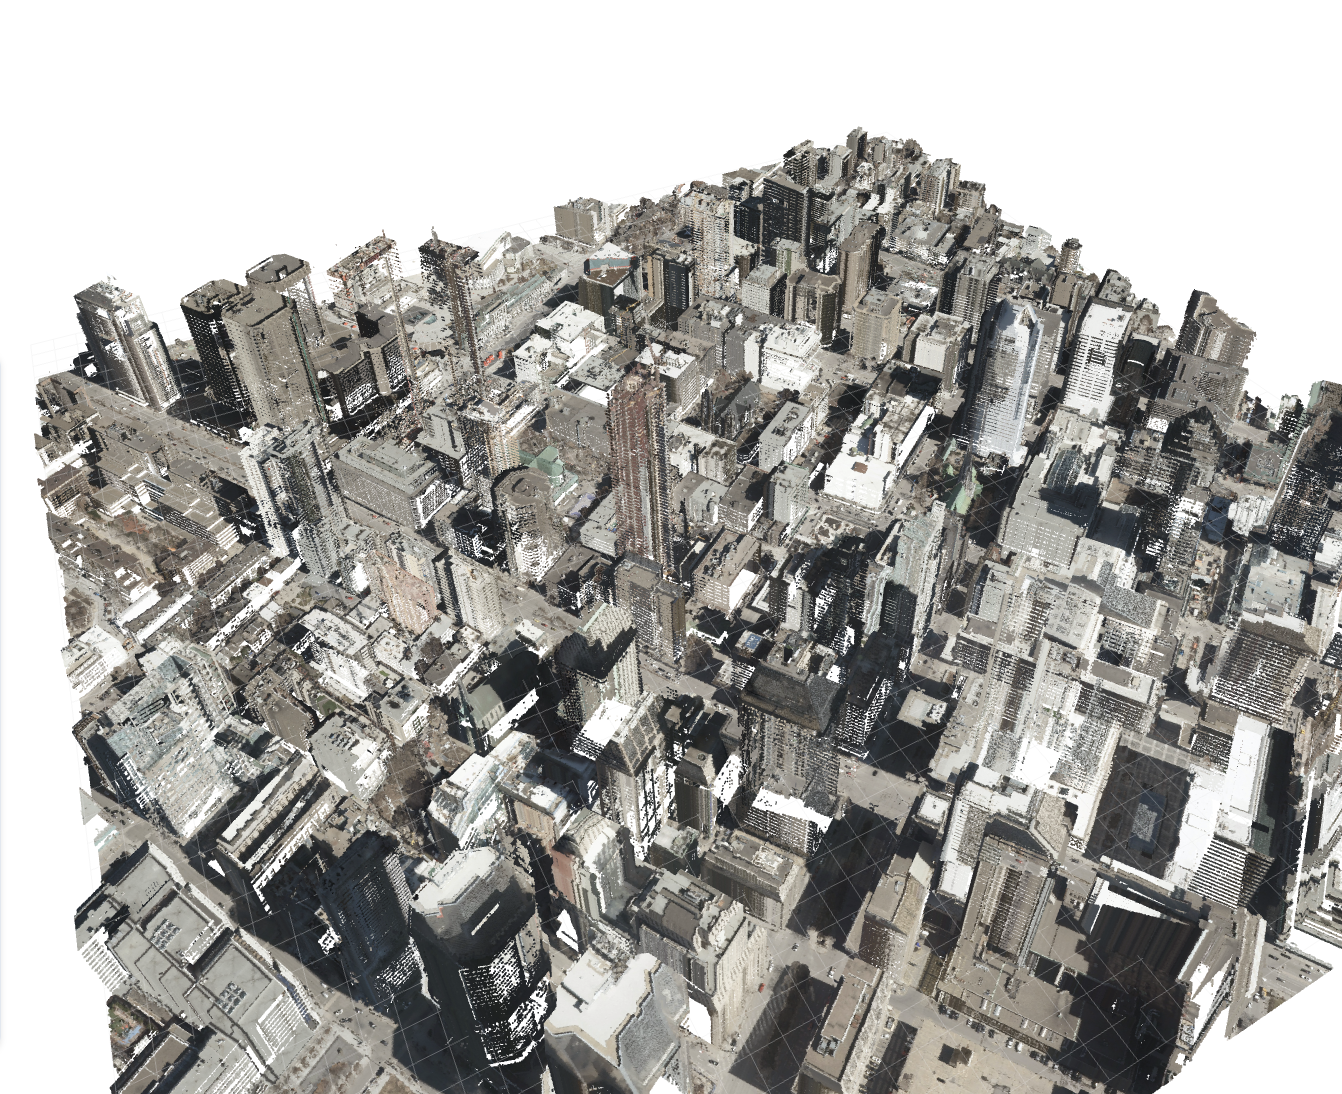
Montreal 3d LiDAR
Exploratory visualization of LIDAR data in Montreal using raw laz files converted to bins via Python.
I’m currently working on integrating additional tiles and loading data more efficiently.
Work in progress: early beta release

This web map of the city of Berlin visualises temperature conditions, cold air conditions and shaded areas. It is based on a simulation of solar radiation using a digital terrain model and the interpolation of climatic model data from the Berlin Senate Department for Urban Development and was developed using R, RGrass and Mapbox.
Created in collaboration with TechnologieStiftungBerlin

Wahlbezirke Editor
The objective of this project is the development of a software that helps city employees adjust the boundaries of electoral or voting districts (Wahlbezirke) between election years. Our final product is a user-friendly tool that automatically generates and evaluates optimized districting maps for Berlin’s boroughs (Bezirke). The intuitive interface allows users to make their own modifications to algorithmically generated electoral maps. Our algorithm uses official governmental data in order to generate iterations that maximize both the geographical compactness of districts and the evenness of the population distribution across the borough.
Created in collaboration with TechnologieStiftungBerlin
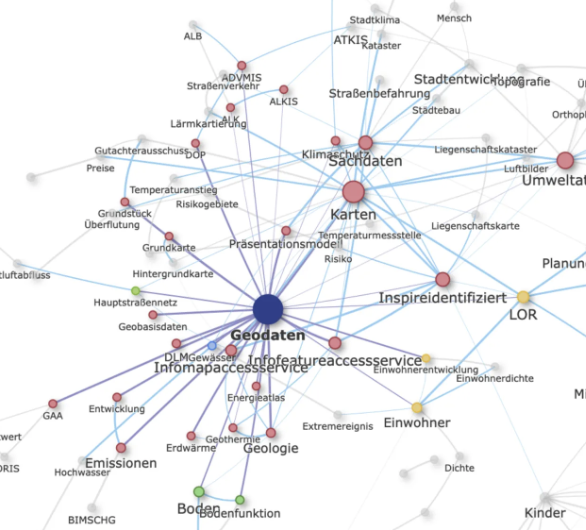
Netzwerkanalyse von Open-Data-Tags
The project analyzes tags used in the Berlin Open Data Portal through a network analysis to reveal thematic clusters and relationships between datasets. An interactive visualization shows frequently co-occurring tags, the strength of their connections, and automatically identified topic areas, highlighting two main clusters around geospatial data and health/social data. The findings provide insights into the structure and focus of Berlin’s open data ecosystem and emphasize the importance of well-designed metadata tags for data discoverability. Made using R and HTML (see Github repo).
Created in collaboration with TechnologieStiftungBerlin
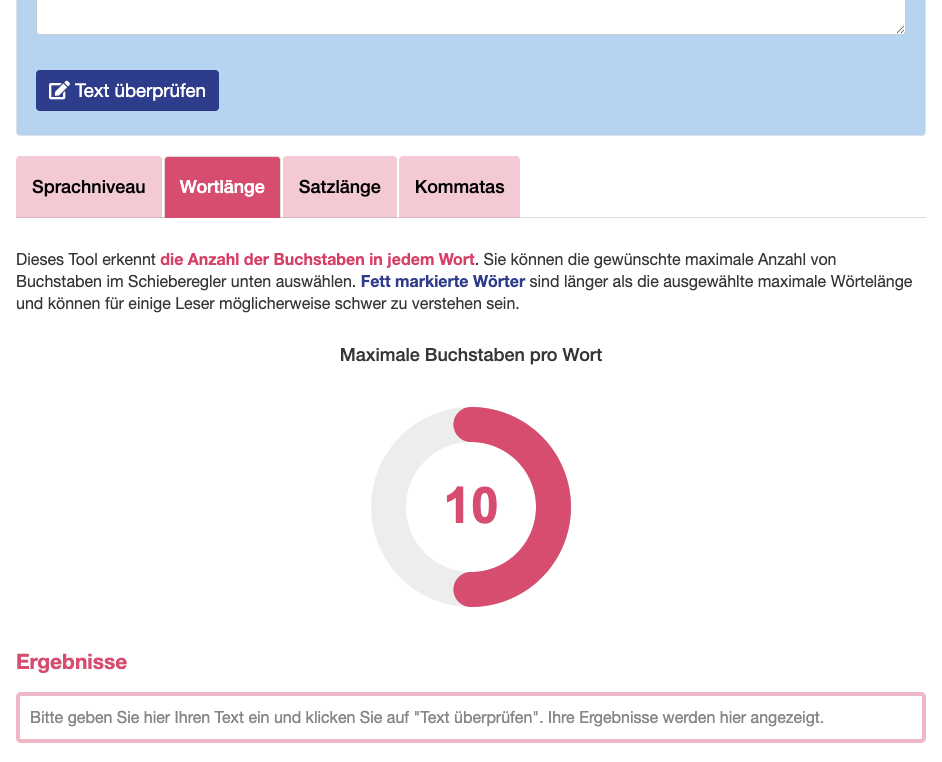
This tool performs a diagnosis of the level of complexity of German texts. It provides 4 different diagnostics. (1) Sprachniveau (language level): allows the user to identity the words that are not encompassed in language levels A1, A2 or B1 (default: B1). (2) Wortlänge (word length): allows the user to identify words containing more letters than a self-defined limit (default: 10 letters). (3) Satzlänge (sentence length): allows the user to identify sentences containing more words than a self-defined limit (default: 30 words). (4) Kommatas (commas): allows the user to identify sentences containing more commas than a self-defined limit (default: 3 commas). Created using R and Shiny.